 PGFplots 中文文档
AddPlot
坐标轴中的画线指令
介绍
AddPlot 命令主要包含:\addplot 画二维图和\addplot3 画三维图。 一般用在 Axis 中:
latex
\begin{tikzpicture}[<options>]
  \begin{axis}[<options>]
    \addplot [<options>] coordinates {
      ...
    }
  \end{axis}
\end{tikzpicture}
其中 coordinates 表示以坐标数组的方式插入数据,具体用法和 AddPlot 支持的数据类型请查看 数据源
有时,我们会看到 \addplot+ 这种用法,这里的 + 表示的是使用 Cycle List 的样式。
有关 Cycle List 的介绍请跳到 这里
Options
线条样式
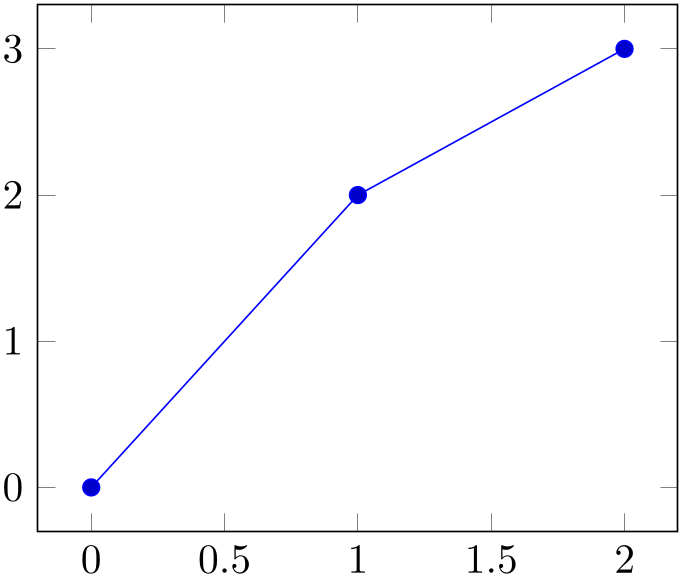
sharp plot:直线,默认样式。
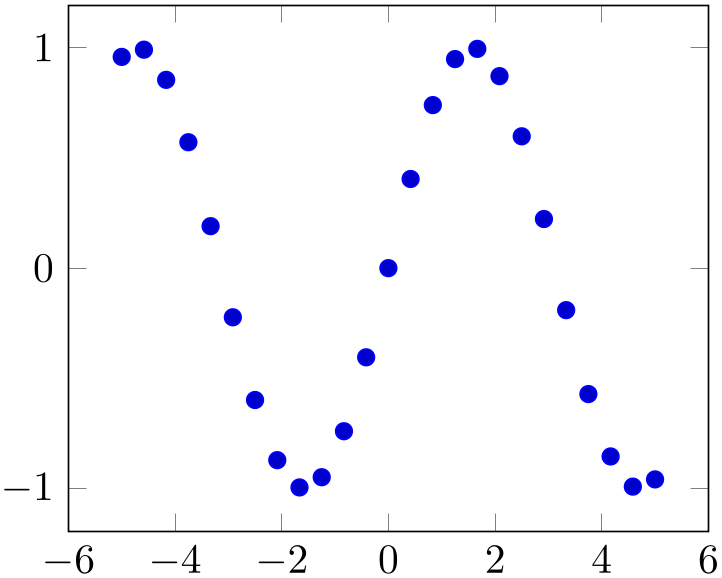
smooth:光滑曲线。
const plot:左折线,等同于const plot mark left。
const plot mark right:右折线。
const plot mark mid:中折线。
线条类型
标记样式
only marks:无标记。
Keys
empty line= auto none scanline jump,控制连线的样式,如 jump 样式:
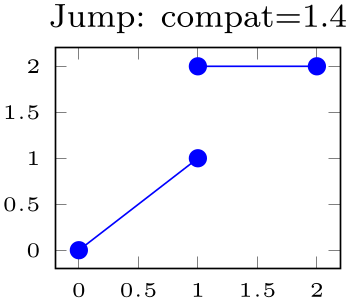
如果是 auto 将根据 线条类型 自动选择样式。
Cycle List
数据点
误差线
todo
我们可以通过 error bars 来添加误差线,如:
latex
\begin{tikzpicture}
\begin{axis}
    \addplot+ [
        error bars/.cd,
            x dir=both,
            x explicit,
    ] coordinates {
        (0,0)   +- (0.1,0)
        (0.5,1) +- (0.4,0.2)
        (1,2)
        (2,5)   +- (1,0.1)
    };
\end{axis}
\end{tikzpicture}其中,coordinates 的数据 +- 后跟着的是误差范围 (dx,dy),即x轴误差和y轴误差,对于三维图像则是 (dx,dy,dz)。
点样式
todo 通过 scatter 和 scatter src 来指定样式,
latex
\begin{tikzpicture}
\begin{axis}[
    scatter/classes={
        a={mark=square*,blue},
        b={mark=triangle*,red},
        c={mark=o,draw=black}   % <-- don't add comma
    },
]
    % \addplot[] is better than \addplot+[] here:
    % it avoids scalings of the cycle list
    \addplot [
        scatter,only marks,
        scatter src=explicit symbolic,
    ] coordinates {
        (0.1,0.15)  [a]
        (0.45,0.27) [c]
        (0.02,0.17) [a]
        (0.06,0.1)  [a]
        (0.9,0.5)   [b]
        (0.5,0.3)   [c]
        (0.85,0.52) [b]
        (0.12,0.05) [a]
        (0.73,0.45) [b]
        (0.53,0.25) [c]
        (0.76,0.5)  [b]
        (0.55,0.32) [c]
    };
\end{axis}
\end{tikzpicture}
全局配置
可以使用:
latex
\pgfplotsset{every axis plot/.append style={...}}对所有的 AddPlot 添加样式。
当然也可以指定每个 Axis 中第4个 AddPlot 的样式:
latex
\pgfplotsset{every axis plot no 3/.append style={...}}由于 AddPlot 的索引是从0开始的,所以这里是no 3